Solar Panel Production By Month Calculator Online
Use the Solar Panel Production By Month Calculator to estimate monthly and annual solar output from system size, peak sun hours, and system losses for planning.
Please complete this field to continue.
Please complete this field to continue.
Please complete this field to continue.
Please complete this field to continue.
Results
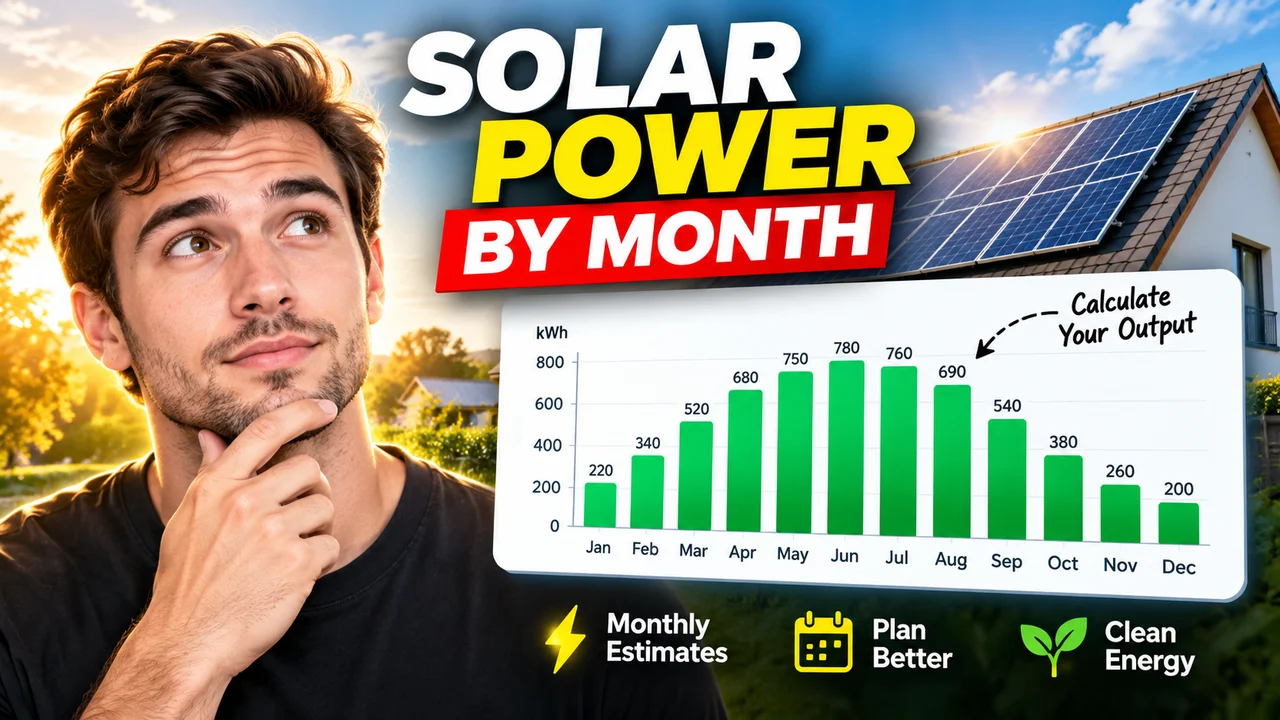
Solar Panel Production By Month Calculator
TL;DR Summary
The Solar Panel Production By Month Calculator estimates monthly and annual solar electricity production from system size, monthly peak sun hours, calendar days, and system losses. It is a planning estimate rather than a full site-specific PV performance simulation, and the supplied tool information does not establish a specific data-storage or privacy policy.
This calculator is designed to make monthly solar production easier to estimate without requiring a complex photovoltaic modeling program. You enter the solar system size, choose the calendar year, enter a system-loss percentage, and provide the average peak sun hours for each month. The calculator then estimates the energy produced in each month and adds those values to produce an annual estimate.
What the Solar Panel Production By Month Calculator Does
Solar panels do not produce the same amount of electricity every month. Solar resource changes with season, weather, daylight, and location. A system may produce more energy during months with stronger solar resource and less during months with weaker resource. The Solar Panel Production By Month Calculator lets you represent those changes directly by entering a monthly average peak-sun-hours value.
Peak sun hours are a way to express solar energy received during a day as an equivalent number of hours at a standard full-sun intensity. The U.S. Department of Energy explains that insolation varies by site and from month to month and is commonly expressed in sun hours. :contentReference[oaicite:4]{index=4}
The tool is useful for homeowners, solar shoppers, installers, students, educators, energy planners, and anyone who needs a simple monthly production estimate. It can also help you understand why a solar system's annual output cannot be estimated well from system size alone.
What You Need to Enter
The first input is the solar system size in kilowatts (kW). This represents the system's DC nameplate capacity. For example, a residential system might be entered as 5 kW.
The second input is the calendar year. The year matters because February has 28 days in a normal year and 29 days in a leap year. The calculator uses the selected year when converting daily solar resource into monthly production.
The third input is system losses. This is entered as a percentage. Losses represent the portion of potential production that is not delivered because of factors such as soiling, shading, mismatch, wiring, connections, degradation, and availability. The default value is 14%, consistent with the default system-loss assumption documented for NREL PVWatts. :contentReference[oaicite:5]{index=5}
The final input is a set of 12 monthly peak-sun-hours values. Each month must be entered once, from January through December. These values should represent the average equivalent peak sun hours per day for the location and system conditions being evaluated.
How to Use
- Step 1: Enter the solar PV system size in kW. Use the system's DC nameplate capacity when that information is available.
- Step 2: Enter the calendar year you want to model so the calculator can account for the correct number of days in February.
- Step 3: Review the system-loss percentage. The default is 14%, but you can change it when you have a better-supported loss estimate for the system.
- Step 4: Enter the average peak sun hours per day for each month. Use location-specific solar-resource information whenever possible.
- Step 5: Make sure every month from January through December appears exactly once.
- Step 6: Review the monthly production results in kWh, then check the annual production and average monthly production totals.
Technical Explanation and Formula
The calculator uses a simplified monthly energy-production formula:
Monthly Production (kWh) = System Size (kW) × Average Peak Sun Hours per Day × Days in Month × (1 − System Losses / 100)
Each variable has a specific meaning:
- System Size: The photovoltaic system's DC capacity, measured in kW.
- Average Peak Sun Hours per Day: The monthly average equivalent full-sun hours per day.
- Days in Month: The number of calendar days in the selected month and year.
- System Losses: The percentage reduction applied to the calculated production.
- Monthly Production: Estimated electrical energy produced during that month, measured in kWh.
For example, suppose a 5 kW system has an average of 5 peak sun hours per day in a 31-day month and the assumed system losses are 14%.
Monthly Production = 5 × 5 × 31 × (1 − 0.14)
Monthly Production = 666.50 kWh
This is a simplified planning calculation. It should not be confused with a detailed PV performance model. NREL's PVWatts calculator estimates grid-connected PV production using location-based solar-resource data and a more detailed modeling approach. Its documentation notes that detailed modeling can account for factors such as irradiance, temperature effects, losses, inverter behavior, and other system characteristics. :contentReference[oaicite:6]{index=6}
Why Monthly Peak Sun Hours Matter
A single annual average can hide important seasonal differences. If January has a lower solar resource than July, using the same daily peak-sun-hours value for both months will not represent that seasonal pattern. Entering separate monthly values allows the calculator to show a different production estimate for each month.
The quality of the monthly result therefore depends strongly on the quality of the peak-sun-hours data you enter. NREL maintains solar-resource data and tools, including the National Solar Radiation Database and PVWatts, for more detailed photovoltaic analysis. :contentReference[oaicite:7]{index=7}
Preset Examples and Quick Reference
| Input | Example | Unit |
|---|---|---|
| System size | 5 | kW DC |
| Calendar year | 2026 | year |
| System losses | 14 | % |
| Monthly peak sun hours | 5 | hours/day |
Using the example values above for a 31-day month produces 666.50 kWh. Actual monthly results will change when the peak sun hours, system size, loss percentage, or number of days changes.
What the Calculator Does Not Do
This tool does not determine a site's solar resource automatically from an address, ZIP code, latitude, or longitude. It also does not perform a full hourly PV simulation. It does not independently model panel temperature, inverter clipping, array tilt, azimuth, tracker behavior, bifacial gain, detailed shading geometry, snow behavior, weather variability, or a specific module and inverter combination.
Those limitations matter because photovoltaic production depends on many site and system characteristics. NREL notes that PVWatts predictions include assumptions and uncertainties and that more sophisticated PV modeling can represent additional system and site characteristics. :contentReference[oaicite:8]{index=8}
Why Use This Solar Panel Production By Month Calculator & How Our Calculator Beats the Competition
| Method | Ease of Use | Calculation Detail | Best For | Limitations |
|---|---|---|---|---|
| Toolhox Calculator | Simple input form | Monthly peak-sun-hours estimate | Quick monthly and annual planning estimates | Requires monthly solar-resource inputs and does not perform full site modeling |
| Manual Calculation | Requires more work | Depends on the formula selected | Learning or checking individual calculations | More opportunity for arithmetic or data-entry errors |
| Spreadsheet | Flexible but setup is required | Depends on spreadsheet design | Custom scenarios and record keeping | Requires building and maintaining formulas |
| Professional PV Software | More setup | Can model more system and site details | Detailed system design and engineering analysis | More inputs and greater modeling complexity |
The practical advantage of this calculator is its focused scope. It turns a small set of inputs into a month-by-month production estimate without requiring the user to build a spreadsheet formula from scratch. Its trade-off is that the calculation is intentionally simpler than a detailed photovoltaic performance model.
Assumptions and Limitations
- The system size is treated as a DC nameplate capacity in kW.
- Peak sun hours are treated as average daily equivalent full-sun hours for each month.
- The entered system-loss percentage is applied as a single combined reduction.
- Monthly production is calculated from average daily solar resource multiplied by the number of days in the month.
- February uses 29 days during leap years.
- The calculator does not independently obtain weather or solar-resource data.
- The calculation does not reproduce NREL PVWatts or another full photovoltaic simulation.
- Results are estimates and depend on the quality of the inputs.
For a purchase decision, system sizing, financing decision, interconnection application, engineering design, or other situation where detailed production estimates are important, compare this estimate with location-specific solar-resource data and an appropriate professional PV modeling tool. NREL specifically identifies PVWatts as a tool for estimating grid-connected PV energy production and provides more detailed solar modeling resources through its PV research tools. :contentReference[oaicite:9]{index=9}
Users should also avoid treating the estimated annual total as a guarantee of actual generation. Weather varies from year to year, and actual production depends on the installed equipment, operating conditions, orientation, shading, maintenance, and other site-specific factors.